I recently spoke at Research Ed, an education conference devoted to bringing evidence-based practices to schools. Surrounded by educators and researchers committed to improving student outcomes, the weekend filled me with inspiration and hope.
Surprisingly, a majority of the educators who attended my presentation had no idea that learning can be measured! They were trained to believe that you can only measure performance and that learning is a “mental process” that can’t be observed. In other words, you can measure the outcome of learning but not the learning process itself.

In the field of behavior science, learning has been measured since the 1930s.
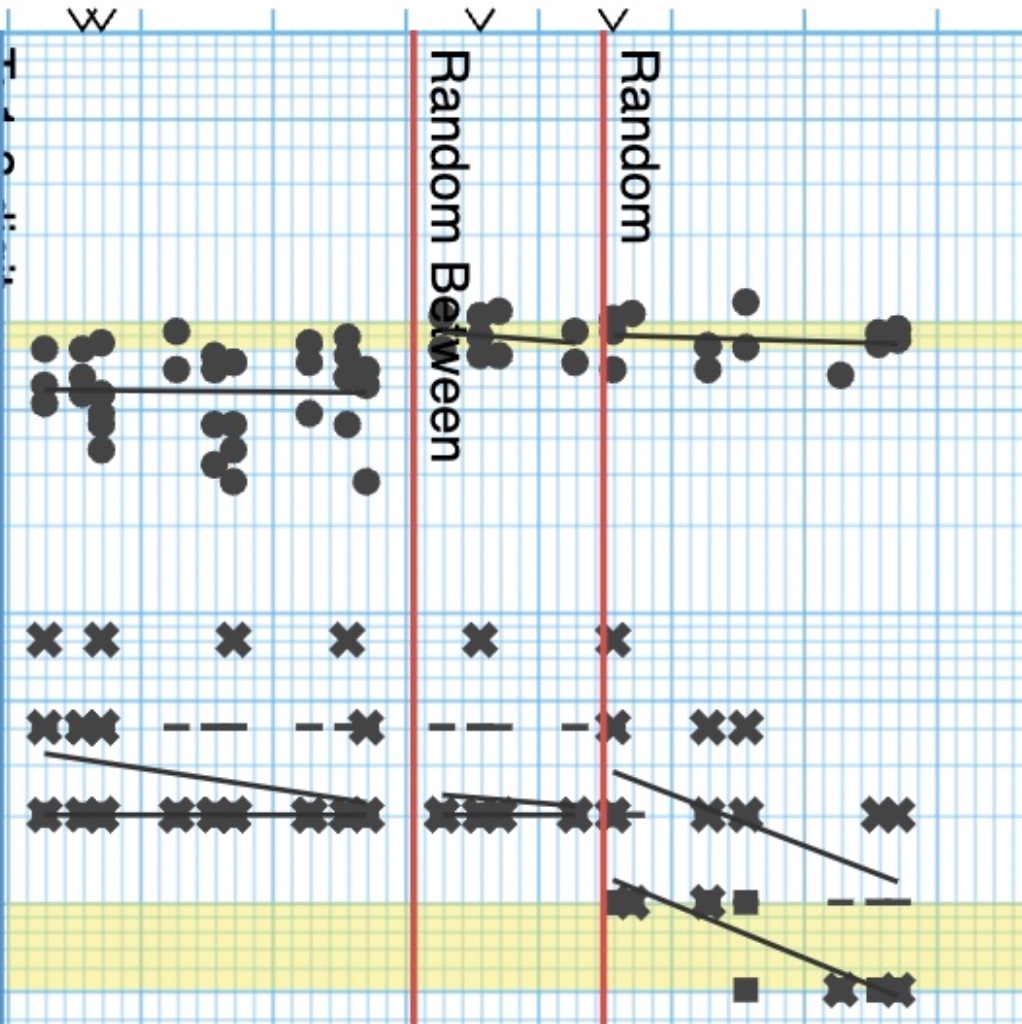
Imagine the educators’ frustration upon realizing that while learning can be measured, they lack the training to do so. During my presentation, I showcased various learning charts. The one shown above demonstrates what learning looks like when skills are measured as rate (count per minute) plotted over days. The dots represent correct responses, while the X’s symbolize errors. As the skill is practiced over time, the rate of correct responses increases, while the rate of errors decreases. The slope of these increasing and decreasing trend lines indicates the speed at which learning is occurring.

Measuring learning over time leads to data-driven instructional decisions such that learners make rapid gains.
In the chart above, we noticed the learner’s correct responses (dots) were highly variable and not increasing, so we made an instructional change indicated by the first red line. When that change worked to increase corrects to the Fluency Aim (upper yellow line), we were able to move the learner back to the original skill and they were able to master it!


